
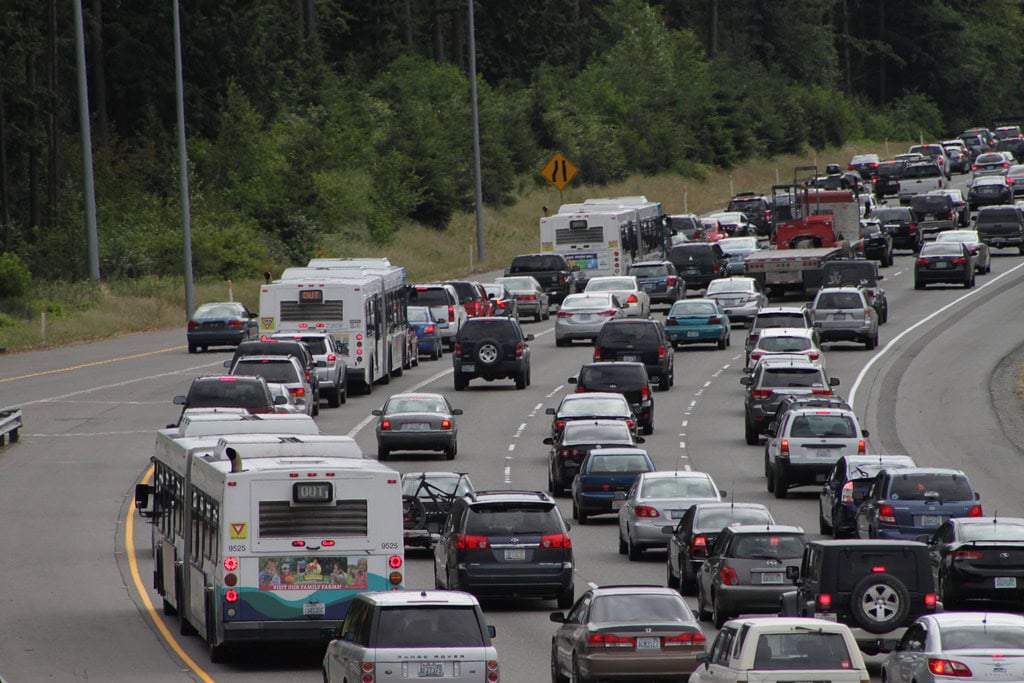
Anyone who’s spent an afternoon on I-5 through Seattle knows a short drive can turn into a long one. Portland drivers have their own complaints. But how do these Pacific Northwest cities really compare with traffic in the rest of the country?
According to TomTom’s 2025 U.S. Traffic Index, Seattle ranked seventh nationally for average congestion, while Portland came in 25th. We’ll compare the two with 13 other U.S. cities, including places where rush hour is even worse and a few that might surprise you.
A note on the numbers: TomTom’s congestion level measures how much longer trips take compared with free-flowing traffic. The average travel time below is for a 10-kilometer (about 6.2-mile) drive, and the annual hours lost estimate is based on a standard 10-kilometer commute each way during weekday rush hours. These are comparable citywide estimates, not a prediction for your particular route.
Seattle
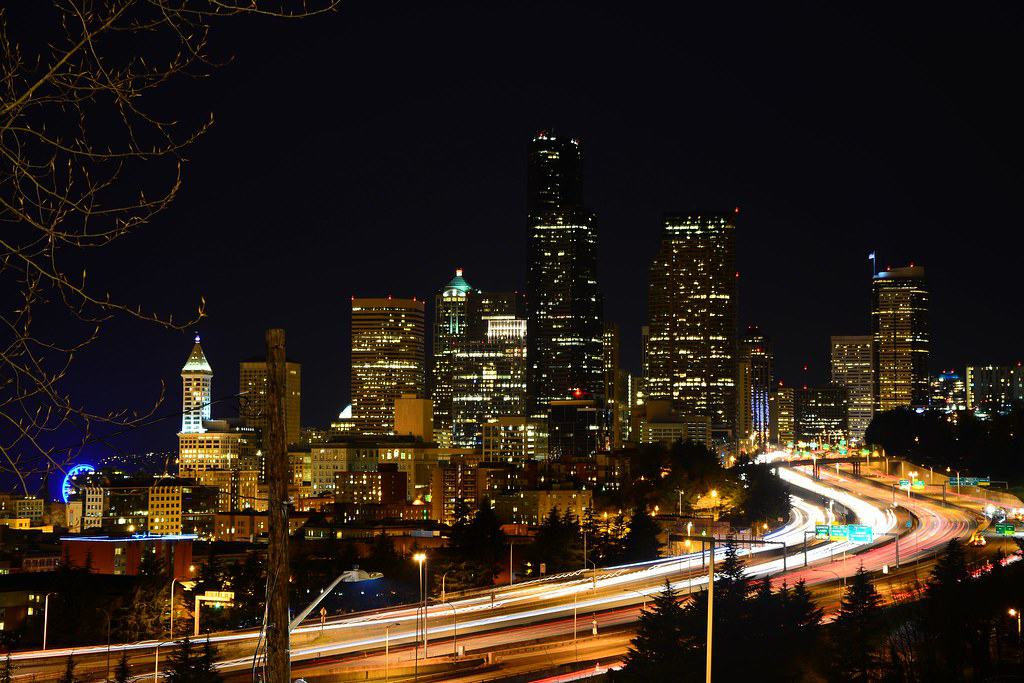
©"Seattle Downtown" by Anupam_ts is licensed under BY-SA 2.0. - Original / License
Seattle drivers know how fast a simple I-5 trip can become an exercise in patience. TomTom ranks the city seventh in the nation for congestion, putting it ahead of Boston and well above Portland. Its rush-hour delays are serious, although the slowest cities on this list still have Seattle beat.
- Average travel time for 10 km (6.2 miles): 17 min 6 sec
- Annual rush-hour time lost: 69 hours
- Average congestion level: 44.9%
- Average rush-hour speed: 17.5 mph
Portland

©"Foggy night in Portland" by Unsettler is licensed under BY-ND 2.0. - Original / License
Portland isn’t exactly a place where every commute is smooth sailing, especially when the bridges and I-5 are involved. Still, TomTom places it 25th nationally for congestion, a good deal below Seattle. For all the complaints drivers in both cities have, the data shows they’re dealing with different levels of gridlock.
- Average travel time for 10 km (6.2 miles): 13 min 27 sec
- Annual rush-hour time lost: 51 hours
- Average congestion level: 37.0%
- Average rush-hour speed: 21.6 mph
Los Angeles
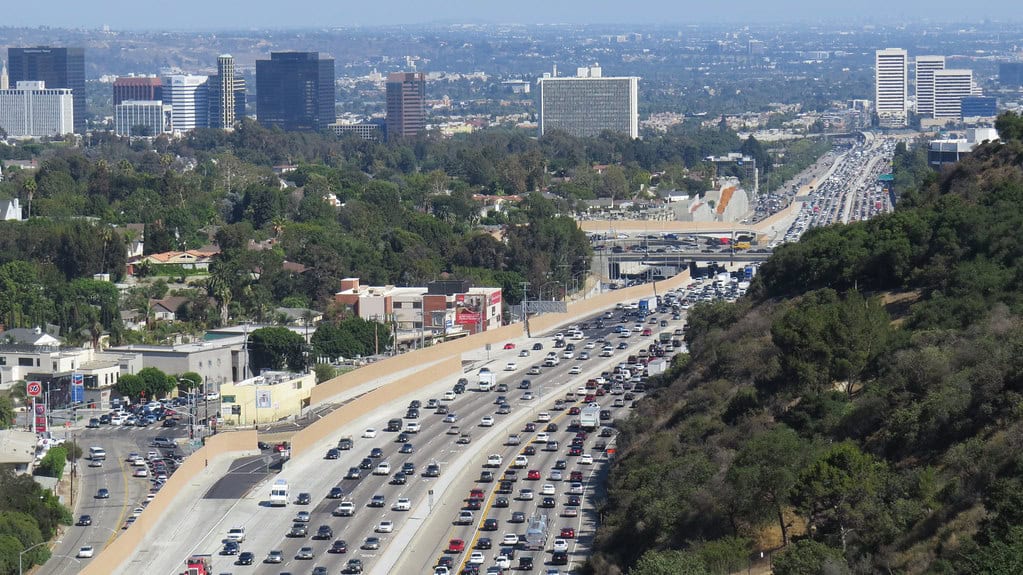
©"Los Angeles Traffic" by Accretion Disc is licensed under BY 2.0. - Original / License
Los Angeles has enough freeways to make a map look like a bowl of spaghetti, and somehow they can still all feel crowded. It ranks first in the country for congestion, though that doesn’t mean it has the slowest average driving speeds. That’s an important distinction when comparing cities with very different road networks.
- Average travel time for 10 km (6.2 miles): 15 min 30 sec
- Annual rush-hour time lost: 83 hours
- Average congestion level: 59.8%
- Average rush-hour speed: 17.1 mph
Honolulu

©"Honolulu, Oahu skyline. Original image from Carol M. Highsmith’s America, Library of Congress collection. Digitally enhanced by rawpixel." by Free Public Domain Illustrations by rawpixel is licensed under BY 2.0. - Original / License
The view might be a lot nicer than your average mainland commute, but that doesn’t make sitting in Honolulu traffic any more fun. Hawaii’s capital ranks second nationwide for average congestion. A short distance on the map is not necessarily a quick drive, particularly when everyone else seems to be heading the same way.
- Average travel time for 10 km (6.2 miles): 20 min 59 sec
- Annual rush-hour time lost: 88 hours
- Average congestion level: 50.5%
- Average rush-hour speed: 14.5 mph
San Francisco
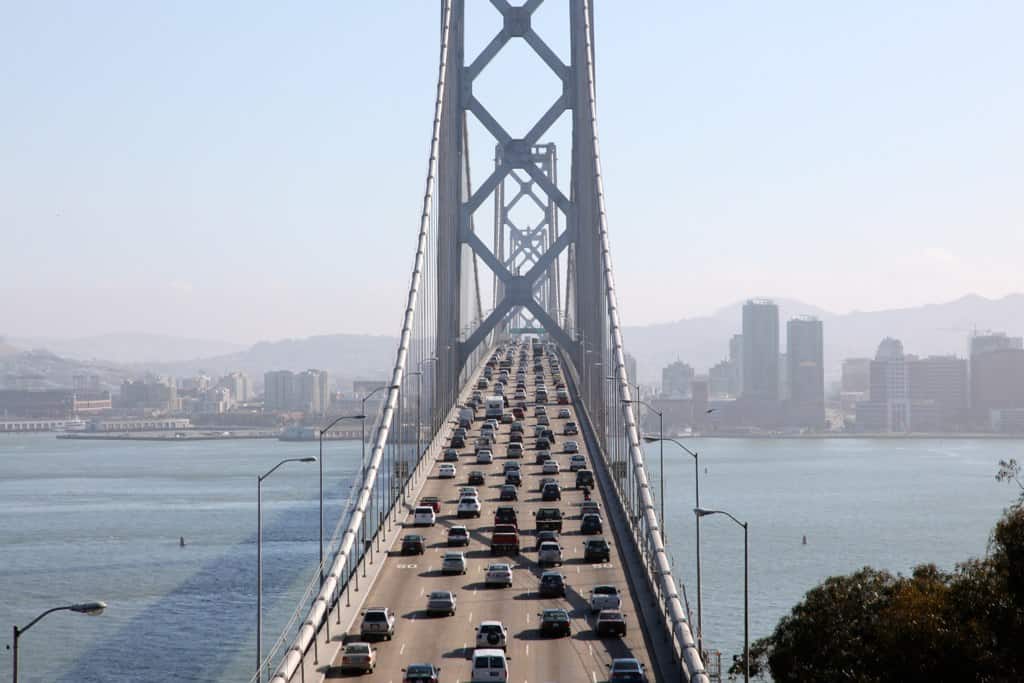
©"Bay Bridge traffic" by Kelly DeLay is licensed under BY 2.0. - Original / License
San Francisco manages to combine a high congestion score with some genuinely slow travel times. It ranks third for congestion, but its average rush-hour speed tells the bigger story. If you’re planning to drive across the city, don’t assume that a handful of miles means a handful of minutes.
- Average travel time for 10 km (6.2 miles): 29 min 42 sec
- Annual rush-hour time lost: 116 hours
- Average congestion level: 49.7%
- Average rush-hour speed: 10.3 mph
New York City

©"Morning rush hour in Manhattan (Seventh Avenue between 33rd and 32nd streets)." by John Wisniewski is licensed under BY-ND 2.0. - Original / License
New York isn’t first in TomTom’s congestion ranking, but it’s easily one of the toughest places here to cover a short distance by car. Its rush-hour speeds are the slowest of the cities we’re comparing, and annual delay tops the group. The subway has its own frustrations, but at least you’re not trying to park in Manhattan.
- Average travel time for 10 km (6.2 miles): 31 min 35 sec
- Annual rush-hour time lost: 125 hours
- Average congestion level: 48.8%
- Average rush-hour speed: 9.8 mph
Miami
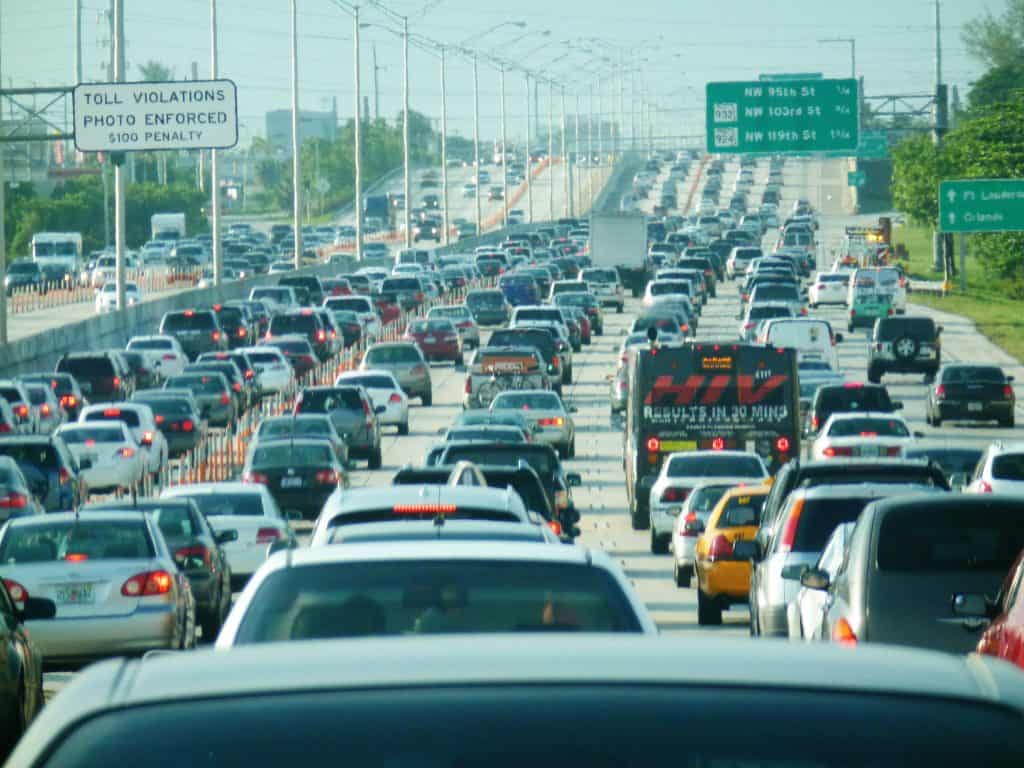
©"Miami traffic congestion, I-95 North rush hour" by B137 is licensed under CC0 1.0. - Original / License
Miami is the sort of city where a quick drive can stop being quick without much warning. TomTom puts it fifth in the country for congestion, just ahead of Chicago. If your plans depend on getting somewhere at a particular time, building in a little breathing room is a smart move.
- Average travel time for 10 km (6.2 miles): 17 min 45 sec
- Annual rush-hour time lost: 72 hours
- Average congestion level: 46.8%
- Average rush-hour speed: 17.0 mph
Chicago
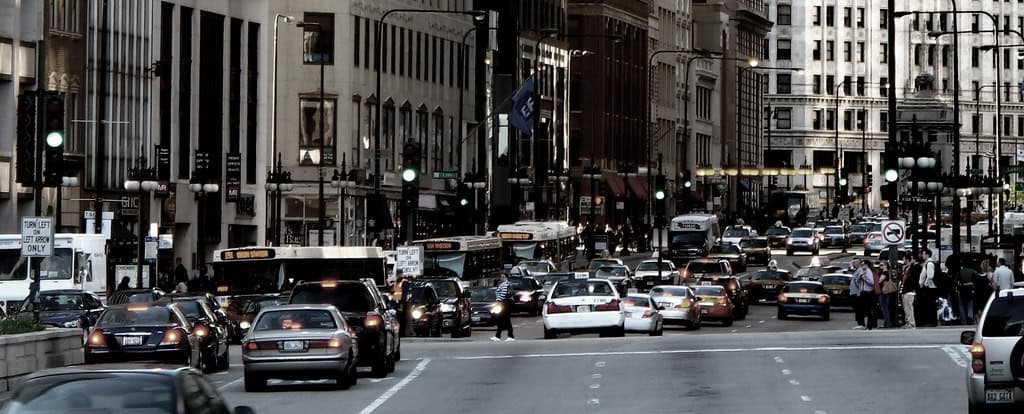
©"Chicago - traffic on Michigan Ave" by ruffin_ready is licensed under BY 2.0. - Original / License
Chicago has trains, buses, and plenty of ways to avoid driving, which can look especially appealing once the expressways fill up. It lands sixth on TomTom’s congestion list, directly ahead of Seattle. For visitors, this is one of those cities where checking the transit options can be worth the effort.
- Average travel time for 10 km (6.2 miles): 18 min 59 sec
- Annual rush-hour time lost: 79 hours
- Average congestion level: 46.1%
- Average rush-hour speed: 15.3 mph
Boston

©"Boston" by allenran 917 is licensed under BY 2.0. - Original / License
Boston’s roads have never been mistaken for a neatly laid-out grid, and driving through the city can test your sense of direction as much as your patience. It ranks ninth for congestion, two spots behind Seattle. Even so, its estimated annual rush-hour delay is higher, which shows why one statistic doesn’t tell the whole story.
- Average travel time for 10 km (6.2 miles): 20 min 59 sec
- Annual rush-hour time lost: 86 hours
- Average congestion level: 42.1%
- Average rush-hour speed: 13.9 mph
Baltimore

©"Baltimore City Right After Sunset" by Patrick Gillespie is licensed under BY 2.0. - Original / License
Baltimore sits farther down the congestion ranking than Seattle or Boston, but it didn’t exactly have an easy year. TomTom recorded a 9.5-percentage-point rise in congestion from 2024 to 2025. That’s a substantial jump, even if the city’s overall ranking is lower than some of the better-known traffic trouble spots.
- Average travel time for 10 km (6.2 miles): 19 min 56 sec
- Annual rush-hour time lost: 71 hours
- Average congestion level: 37.7%
- Average rush-hour speed: 15.3 mph
Denver

©"Denver Skyline at Sunset" by Larry Johnson is licensed under BY 2.0. - Original / License
Denver may not crawl along at New York speeds, but anyone familiar with a busy stretch of I-25 knows the commute isn’t always pleasant. It ranks 20th for congestion, behind Seattle but ahead of Portland. Average rush-hour speeds are comparatively better here, which helps put the ranking in perspective.
- Average travel time for 10 km (6.2 miles): 13 min 25 sec
- Annual rush-hour time lost: 51 hours
- Average congestion level: 37.6%
- Average rush-hour speed: 21.9 mph
Philadelphia
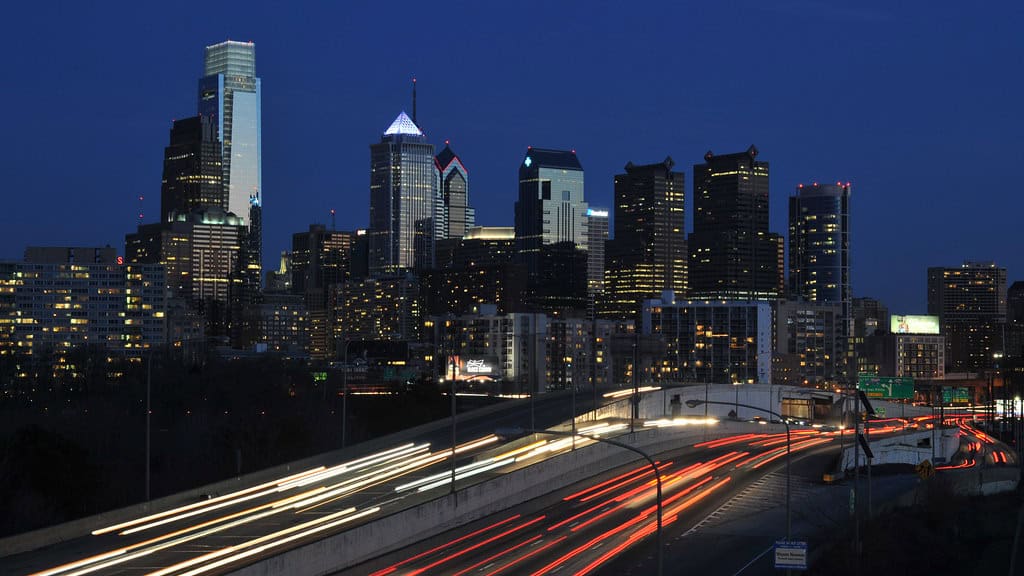
©"Philadelphia Night Skyline" by Chris Hunkeler is licensed under BY-SA 2.0. - Original / License
Philadelphia lands 21st by congestion percentage, which sounds fairly tame compared with the cities near the top. Look at the travel-time numbers, though, and it’s clear that getting across town is another matter. This is a good example of why congestion rankings and actual driving speeds aren’t interchangeable.
- Average travel time for 10 km (6.2 miles): 21 min 35 sec
- Annual rush-hour time lost: 72 hours
- Average congestion level: 37.5%
- Average rush-hour speed: 14.5 mph
Washington D.C.
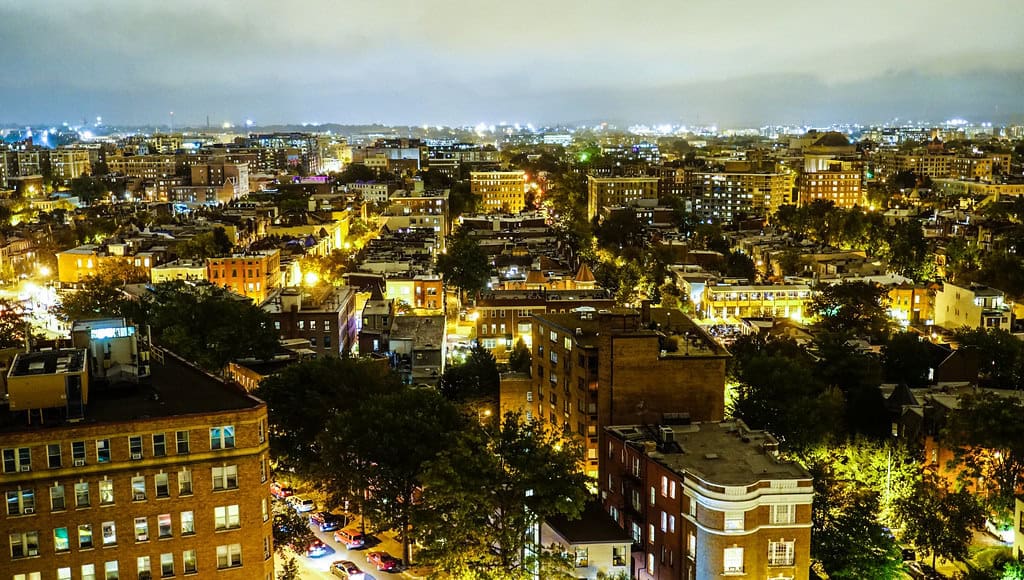
©"2017.10.12 Capital Pride Volunteer Appreciation, Washington, DC USA 9494" by tedeytan is licensed under BY-SA 2.0. - Original / License
Washington, D.C., once appeared near the top of this article’s older ranking, but TomTom’s latest congestion measure puts it 22nd nationwide. Traffic is still plenty capable of disrupting a schedule, and its congestion level rose from 2024. The ranking changed; the need to allow extra driving time didn’t disappear.
- Average travel time for 10 km (6.2 miles): 19 min 29 sec
- Annual rush-hour time lost: 72 hours
- Average congestion level: 37.3%
- Average rush-hour speed: 15.3 mph
Pittsburgh

©"night in Pittsburgh" by brdonovan is licensed under BY-SA 2.0. - Original / License
Pittsburgh’s rivers, hills, and bridges give it plenty of character, but they don’t always make driving straightforward. The city ranks 23rd nationally for congestion, two spots ahead of Portland. Its rush-hour numbers are lower than Seattle’s, though that won’t be much comfort when you’re sitting at a red light.
- Average travel time for 10 km (6.2 miles): 16 min 16 sec
- Annual rush-hour time lost: 61 hours
- Average congestion level: 37.3%
- Average rush-hour speed: 18.3 mph
Columbia
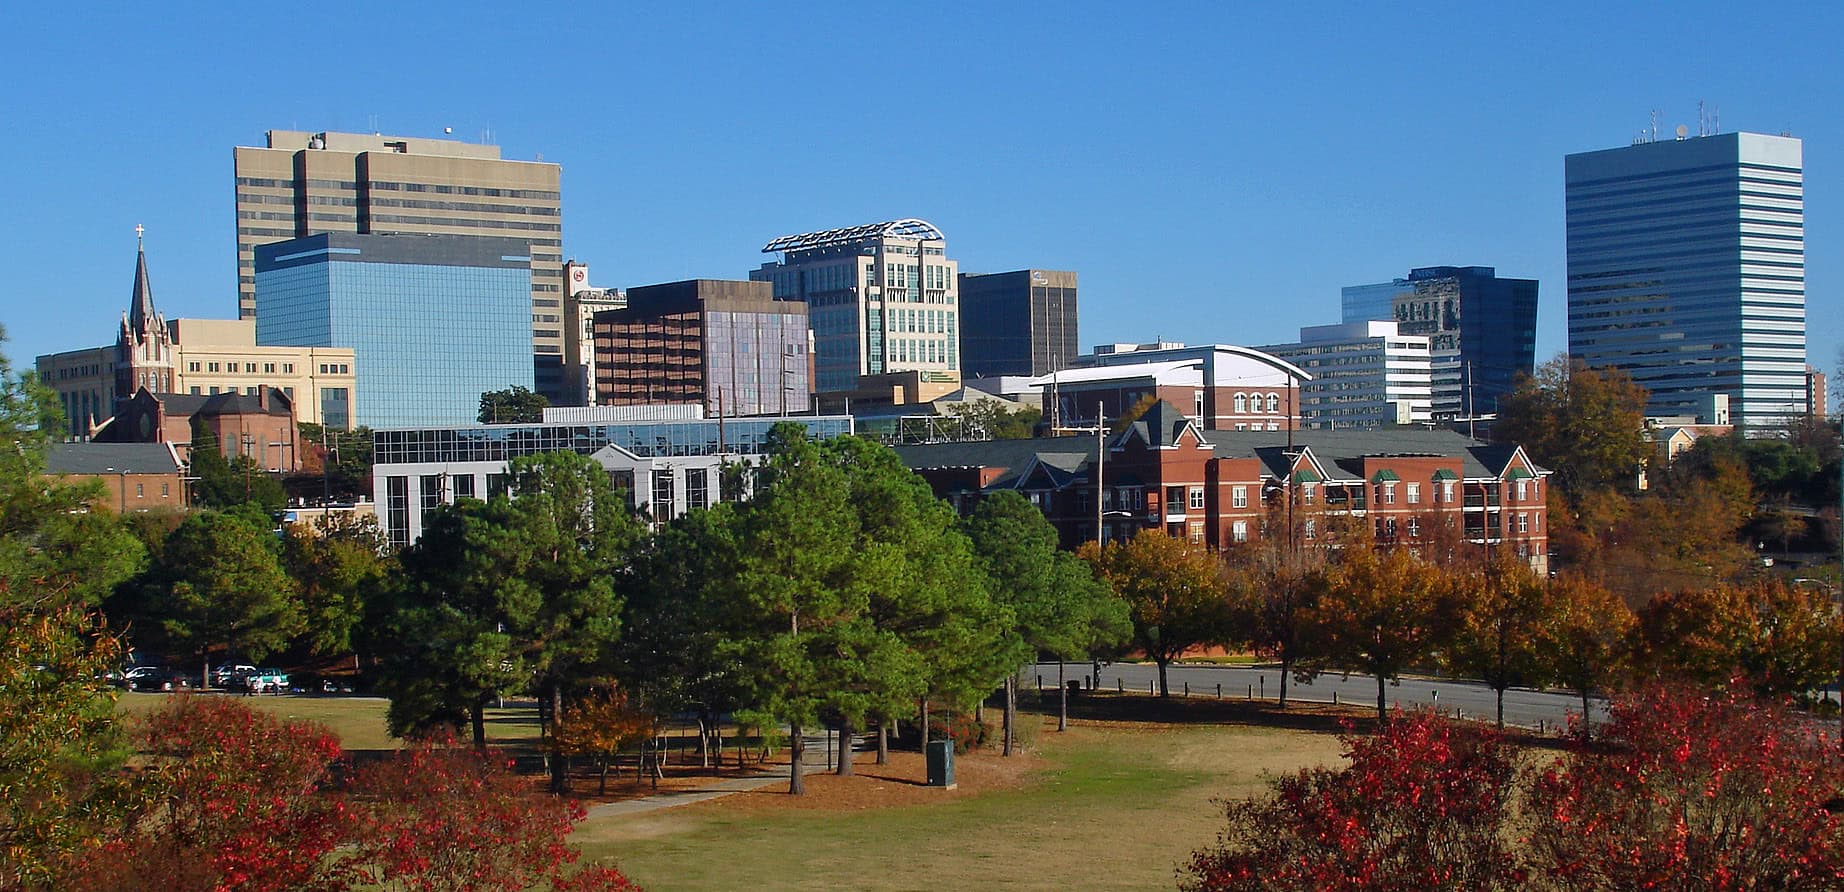
©"File:Fall skyline of Columbia SC from Arsenal Hill.jpg" by Akhenaton06 is licensed under BY-SA 3.0. - Original / License
Columbia, South Carolina, probably isn’t the first place that comes to mind when someone mentions gridlock. Yet it sits 26th in TomTom’s U.S. congestion ranking, immediately behind Portland. A smaller city doesn’t automatically mean a painless drive, even if its congestion score is below Seattle’s.
- Average travel time for 10 km (6.2 miles): 20 min 20 sec
- Annual rush-hour time lost: 58 hours
- Average congestion level: 36.6%
- Average rush-hour speed: 16.7 mph

